Question Title
How to position the chart at the far left of the canvas in the vchart chart library?
Question Description
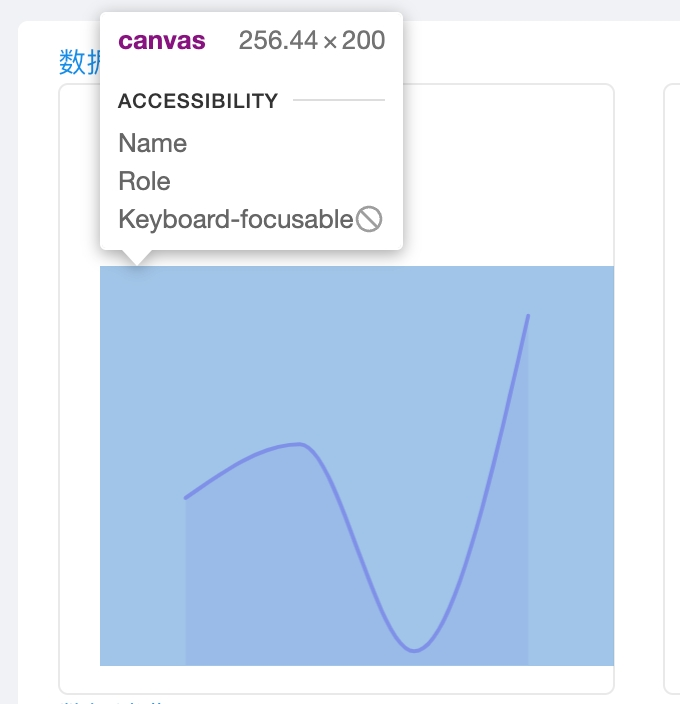
I am using the vchart chart library for visualization operations, and I hope that the chart can be located at the far left of the canvas. However, I had a problem when trying to adjust the configuration. I don't know how to set it.
{
type: 'line',
data: {
values: [
{
time: '2:00',
value: 8
},
{
time: '4:00',
value: 9
},
{
time: '6:00',
value: 11
},
{
time: '8:00',
value: 14
},
{
time: '10:00',
value: 16
},
{
time: '12:00',
value: 17
},
{
time: '14:00',
value: 17
},
{
time: '16:00',
value: 16
},
{
time: '18:00',
value: 15
}
]
},
xField: 'time',
yField: 'value',
axes:[
{
type:'band',
orient:'bottom',
visible:false,
},
{
orient:'left',
visible:false,
}
]
};</br>


Solution
In the configuration items of vchart, there is a trimPadding attribute. This attribute is used to configure whether to remove the margins at both ends of the band axis. If it is true, there will be no margins at both ends, and the settings of bandPadding, paddingInner and paddingOuter will be ignored.
And here, what we need is to place the chart on the far left of the canvas, that is, without the left margin, so we need to add the trimPadding configuration on the 'bottom' axis.
Below is an example of the configuration:
{
//...other spec configurations omitted
axes:[
{
type:'band',
orient:'bottom',
visible:false,
trimPadding:true,
},
{
orient:'left',
visible:false,
}
]
};</br>
Result Display
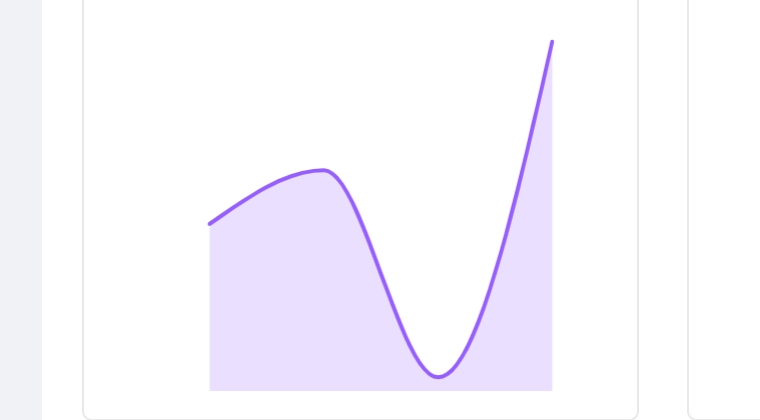
After adding the trimPadding configuration, the chart can now be properly displayed at the far left of the canvas.
Online effect reference: https://codesandbox.io/p/sandbox/common-chart-interactive-forked-cn95kp
Related Documents
Related API: https://visactor.bytedance.net/vchart/option/barChart-axes-band#trimPadding
github: https://github.com/VisActor/VChart
